Blog 2
Introducing the AWS WAF Traffic Overview Dashboard
Today I want to share an extremely useful update that makes operating systems much easier: the AWS WAF traffic overview dashboard.
For network security engineers, protecting application uptime requires continuously monitoring baseline traffic and investigating suspicious IPs. The challenge is how to scale the application without “bloating” the SOC (Security Operations Center) team. To solve this “pain point”, AWS WAF launched the traffic overview dashboard, helping engineers make quick and accurate decisions.
What’s special about this Dashboard?
The most valuable point is that it is completely free and available by default; you do not need to spend time setting it up.
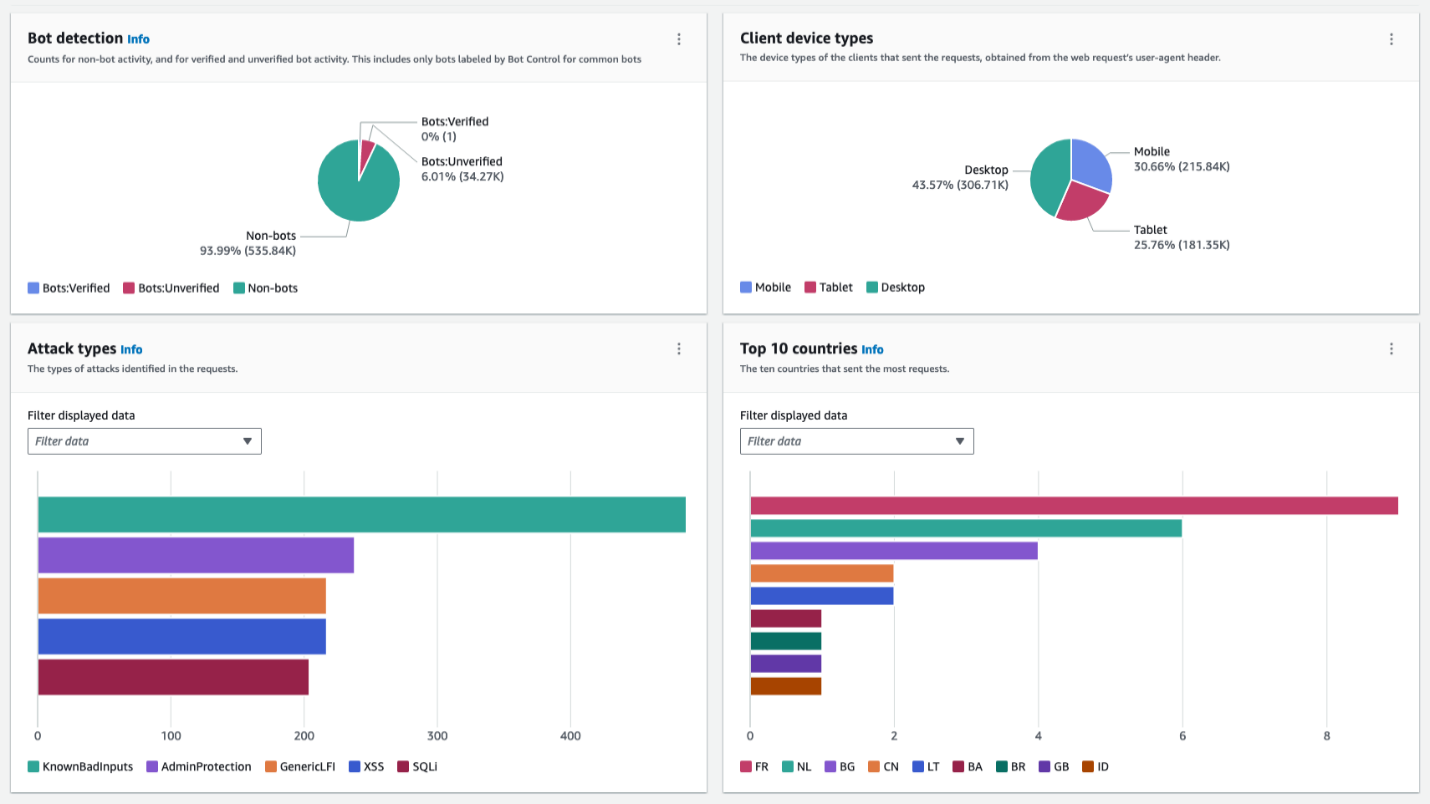
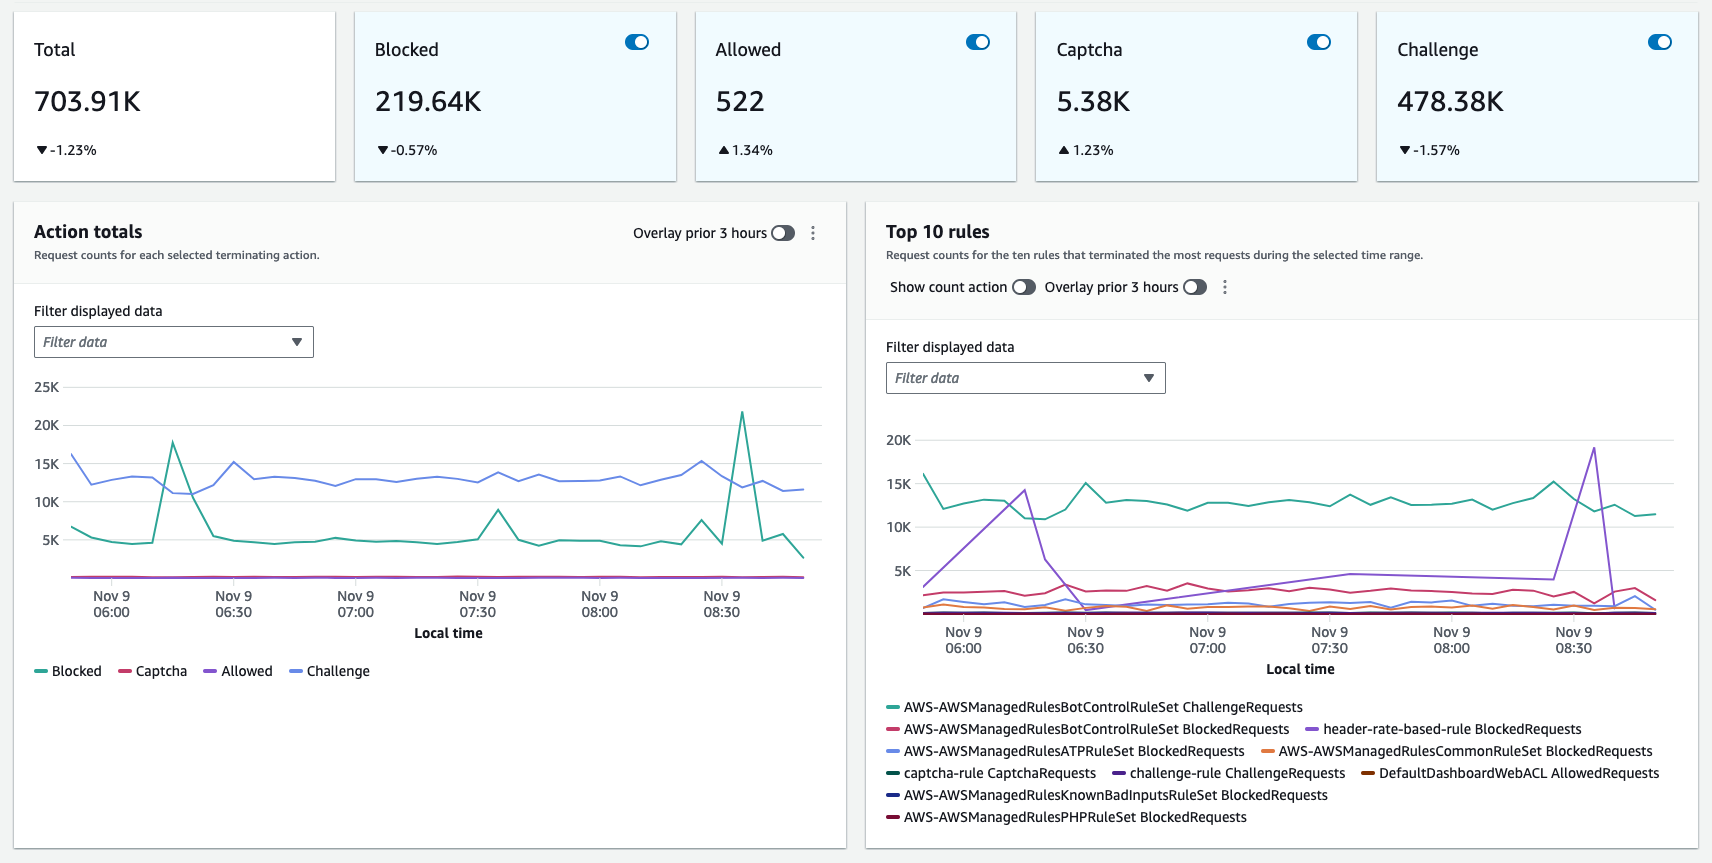
The dashboard provides a near real-time view of metrics from CloudWatch that WAF collects. You can view total requests, blocked/allowed requests, compare bot and non-bot traffic, or the top 10 most active rules. In particular, the Sampled requests tool has now been separated into its own tab, allowing you to view in detail 100 requests matching rules and 100 requests applying default actions in the last 3 hours.
It categorizes requests with detailed analytics (attack type, device type, country). For example, if your application is intended only for Desktop in Vietnam, but you see a sudden spike in traffic from Mobile in France, you can decide to block it immediately.
Use Case 1: Pattern Analysis and System “Diagnosis”
Not just for show, use the dashboard to hunt for abnormal spikes. Suppose the system normally receives 2,000 requests/minute, but suddenly jumps to 10,000 requests/minute along with an undesired device type, that is a signal to investigate immediately.
If the dashboard shows a rule blocking a large amount of traffic, it clearly indicates the system is being targeted by a specific attack vector.
Next actions after analysis:
- Tune WAF rules: Edit regex to reduce false positives or false negatives.
- Auto-block IPs: Use the Amazon IP reputation list to auto-block malicious IPs.
- DDoS mitigation: Monitor source IPs and use rate-based rules to cut off request spikes.
Use Case 2: Monitor and Optimize Bot Control
If you are using AWS WAF Bot Control, this dashboard will clearly show what percentage of traffic comes from Bots (scrapers, scanners, crawlers…).
- Early phase (onboarding): You should enable Bot Control rule groups in Count mode and use the dashboard to see if any valid traffic is mislabeled (thereby adding rule exceptions).
- Handling sophisticated bots: AWS WAF uses browser fingerprinting, silent challenges, or CAPTCHA and assigns Tokens. The Token status table on the dashboard helps you monitor the amount of requests missing Tokens or having invalid Tokens. From there, you can write rules that run right after the managed rule group to block or rate limit requests that fail this bot test.
Quick Comparison: WAF Dashboard vs CloudFront Security Dashboard
Many engineers wonder which one is better to use:
- AWS WAF Traffic Overview Dashboard: For engineers who need deep analysis (investigate) and to understand traffic patterns to fine-tune detailed security rules.
- CloudFront Security Dashboard: For engineers who want to manage both application delivery and basic security on a single screen without switching consoles.
Summary
This new dashboard truly helps engineers reduce the “guesswork” when analyzing traffic. Regarding costs, the dashboard is provided for free, you only pay for log storage for CloudWatch if full logging is enabled.
Source: Introducing the AWS WAF traffic overview dashboard | AWS Security Blog
Facebook Post: Link to AWS Study Group FB